Case study

Can software spot a big player in the order book?

An order-flow assistant for CME Micro E-mini S&P 500 futures. It rebuilds the full order book from exchange order-by-order data, tracks large resting orders, runs a set of detection agents that estimate whether an institutional algo is active, and turns that context into trade signals I place by hand. Then I tried hard to prove it didn't work.
JavaScript · Canvas Python · pandas Node.js Databento · CME MBO
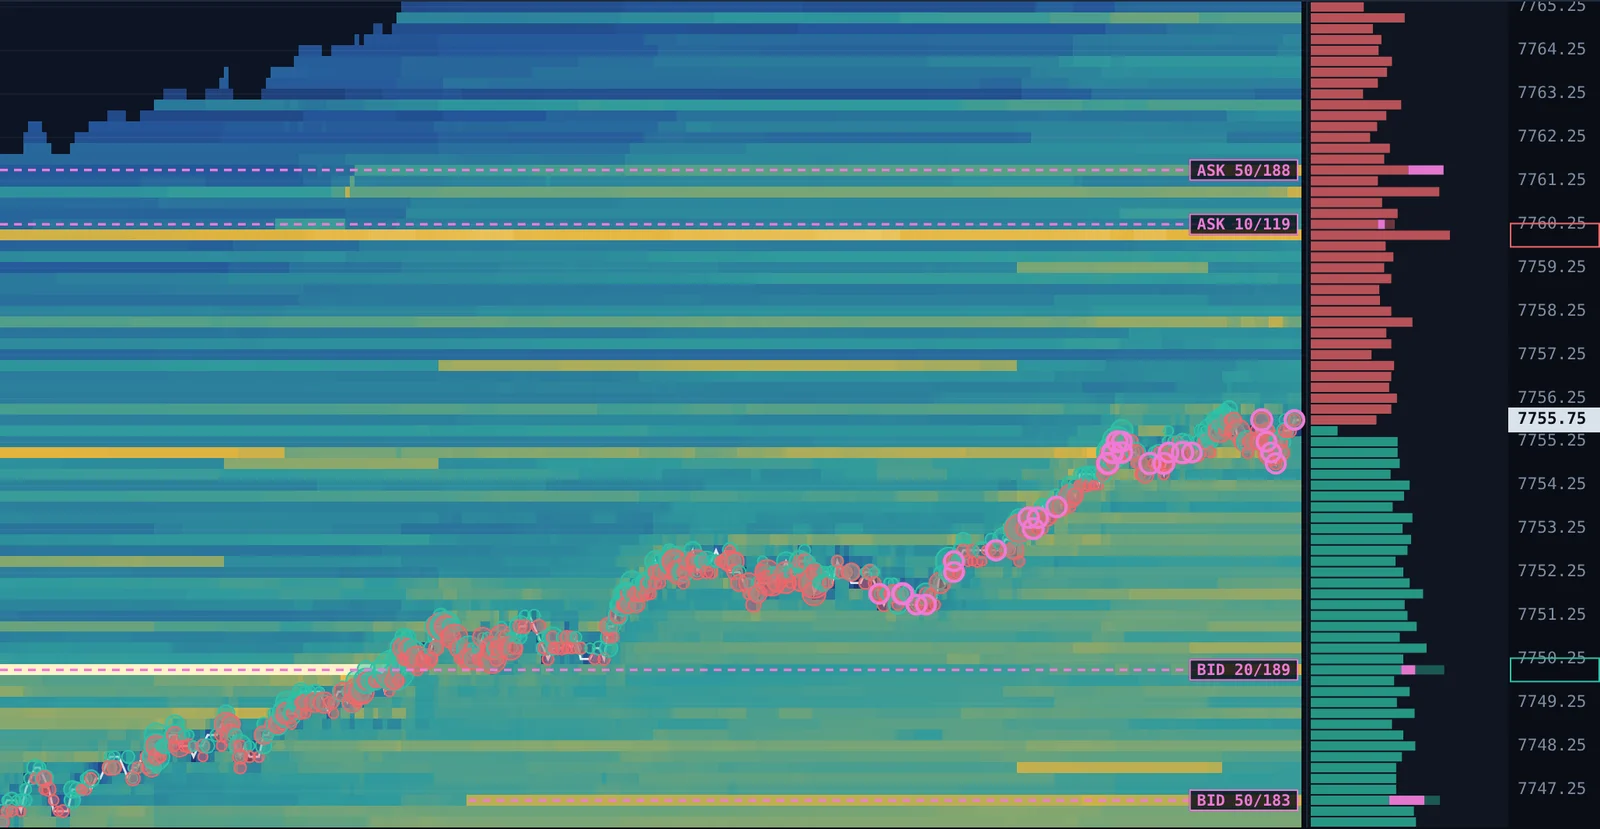
Liquidity heatmap of the MES order book over two hours, with tracked large orders labeled and trade prints overlaid
41
sessions of order-by-order data
~10M
book events replayed per day
2
sealed test periods
100%
of backtest runs logged

Large orders leave footprints. The hard part is reading them without fooling yourself.

When an institution buys or sells size, it rarely does it in one print. It rests large orders in the book and works child orders through the market over minutes. A trader who can see that activity early can ride the move. Building the tool to see it turned out to be the easier half. The harder half was building a testing process strict enough that a good backtest actually means something, because a backtest will happily tell you whatever you tune it to say.

The build

Five layers, from raw exchange messages to a signal.

01

Order book reconstruction (Python)

Reads CME market-by-order data from Databento, about 10 million add, cancel, modify and fill messages per session, and rebuilds the book with exchange queue rules. Output is a per-second depth snapshot plus an event log for every large resting order: placed, refilled, moved, partially filled, pulled.

02

Liquidity map (JavaScript, Canvas)

A heatmap of resting size over time with trade prints overlaid, tracked large orders labeled by size and queue position, and a depth ladder showing each big order's share of its price level.

03

Detection agents

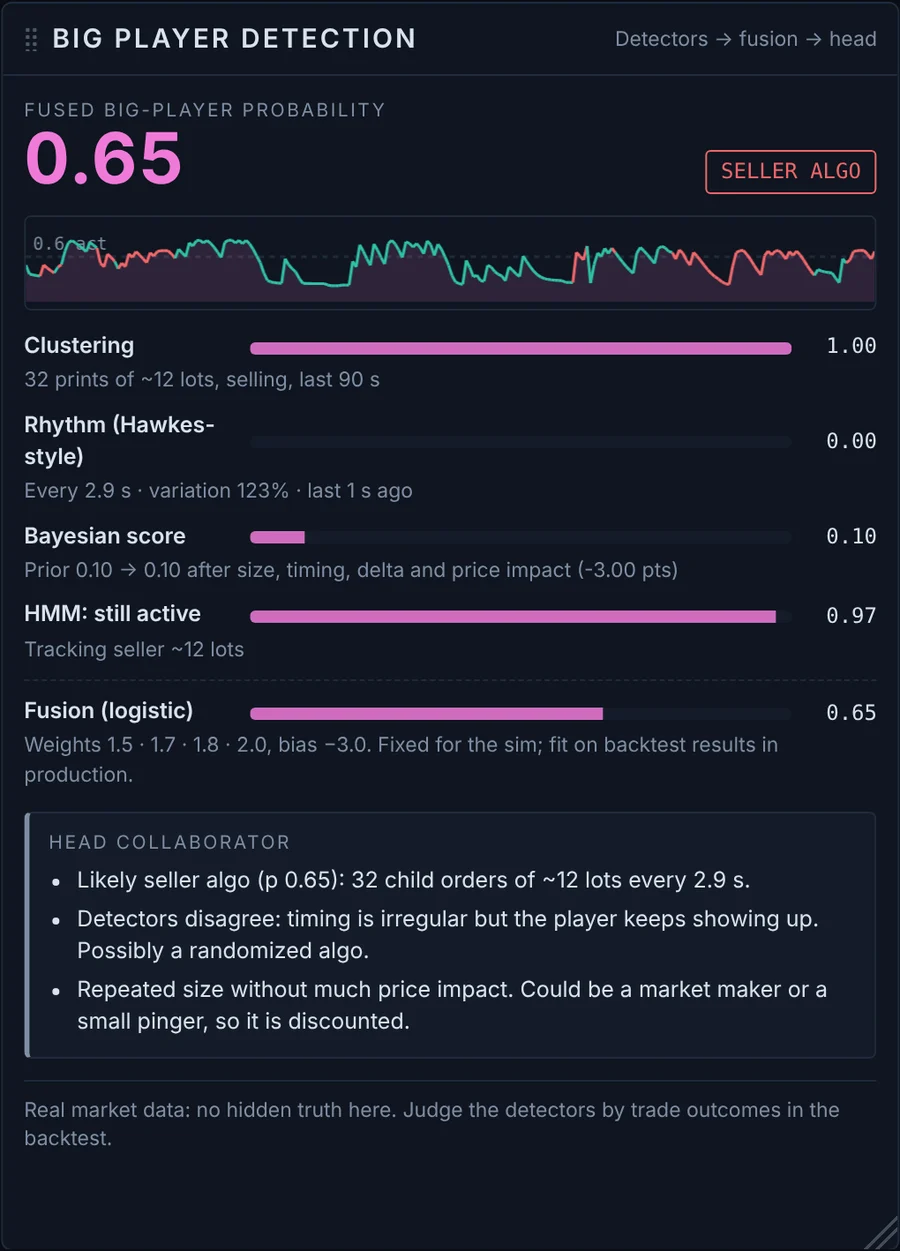
Four independent detectors look for an algo working an order: size clustering, a Hawkes-style rhythm model, a Bayesian score and a hidden Markov model. A logistic fusion step combines them, and a head collaborator explains in plain English when they agree and when they don't.

04

Strategy layer

A rules-based layer combines market context with order-book events into entry and exit signals, with a hard stop, a trailing exit and a daily loss limit. It extends the decision logic from my Apex Overlay.

The specific entry rules, thresholds and settings stay private. This page covers the system and the process, not the edge.
05

Replay and backtest engine

Replays real sessions event by event in the browser, or runs dozens of sessions in seconds. The same engine code runs in Node.js for batch testing, so a backtest and the dashboard always match.

Big player detection panel showing four detector scores, a fused probability of 0.65 and the head collaborator's explanation
Detectors, fusion and the head collaborator's read on a live session.
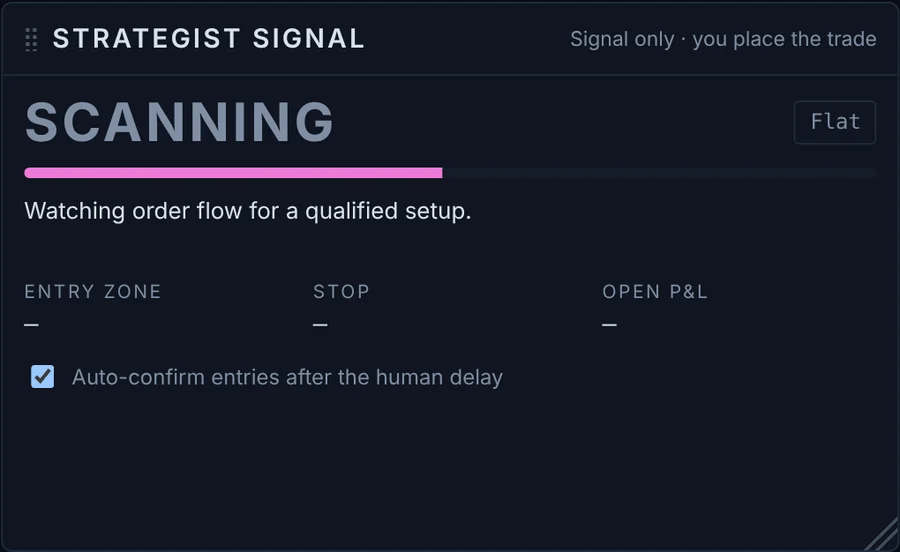
Strategist signal panel in scanning state with entry zone, stop and open P&L fields
Signal only. I place every trade myself.
Testing discipline

Built so the results could prove me wrong.

A strategy tuned on the same data it's scored on will always look good. These rules existed to stop that from happening.

Sealed test data

Settings were tuned only on September 1 to 15. All of August and September 17 to 30 stayed locked in the dashboard until the settings were frozen. When I accidentally saw one sealed day during testing, I excluded it from the results.

✓ 31 sealed sessions, scored once with locked settings

Every run on the record

The dashboard logs every backtest, including re-runs, so it is visible how many versions were tried. Changes were chosen on the development days, then checked once on sealed data. The sealed data never guided a change.

✓ Guards against: cherry-picking, quiet re-tuning, overfitting

Realistic execution

Entries include a human reaction delay. Stops are modeled as resting broker orders that fill on the first touch, after testing showed a periodic-check model was hiding losses.

✓ Worst loss capped at the planned stop

Honest metrics

Yearly Sharpe and Sortino come from daily P&L including flat days, the industry convention, with per-trade values shown alongside. Fees are applied to every reported result.

✓ Same math in the dashboard and the batch tools
What the data taught me

Most of my first ideas were wrong. The process caught them.

  1. My first signal fired at the end of buying bursts, right before price reversed. Zero of 192 parameter combinations were profitable. The fix was a different trigger.
  2. A 64% win rate can still lose money. My original rules won most trades but let a few losers run, and those losses erased the wins. Capping the stop and trailing the exit fixed it.
  3. Requiring two independent signals to agree beat either one alone. It cut trades by more than half and more than tripled profit per trade.
  4. How a stop is simulated changes the answer. Modeling stops as broker orders instead of periodic checks turned a flat month into a positive one.
  5. Small samples lie. One sealed month projected a yearly Sharpe above 11, the next under 1. Same strategy, same settings.
Results

Positive on sealed data, with a sample too small to trust yet.

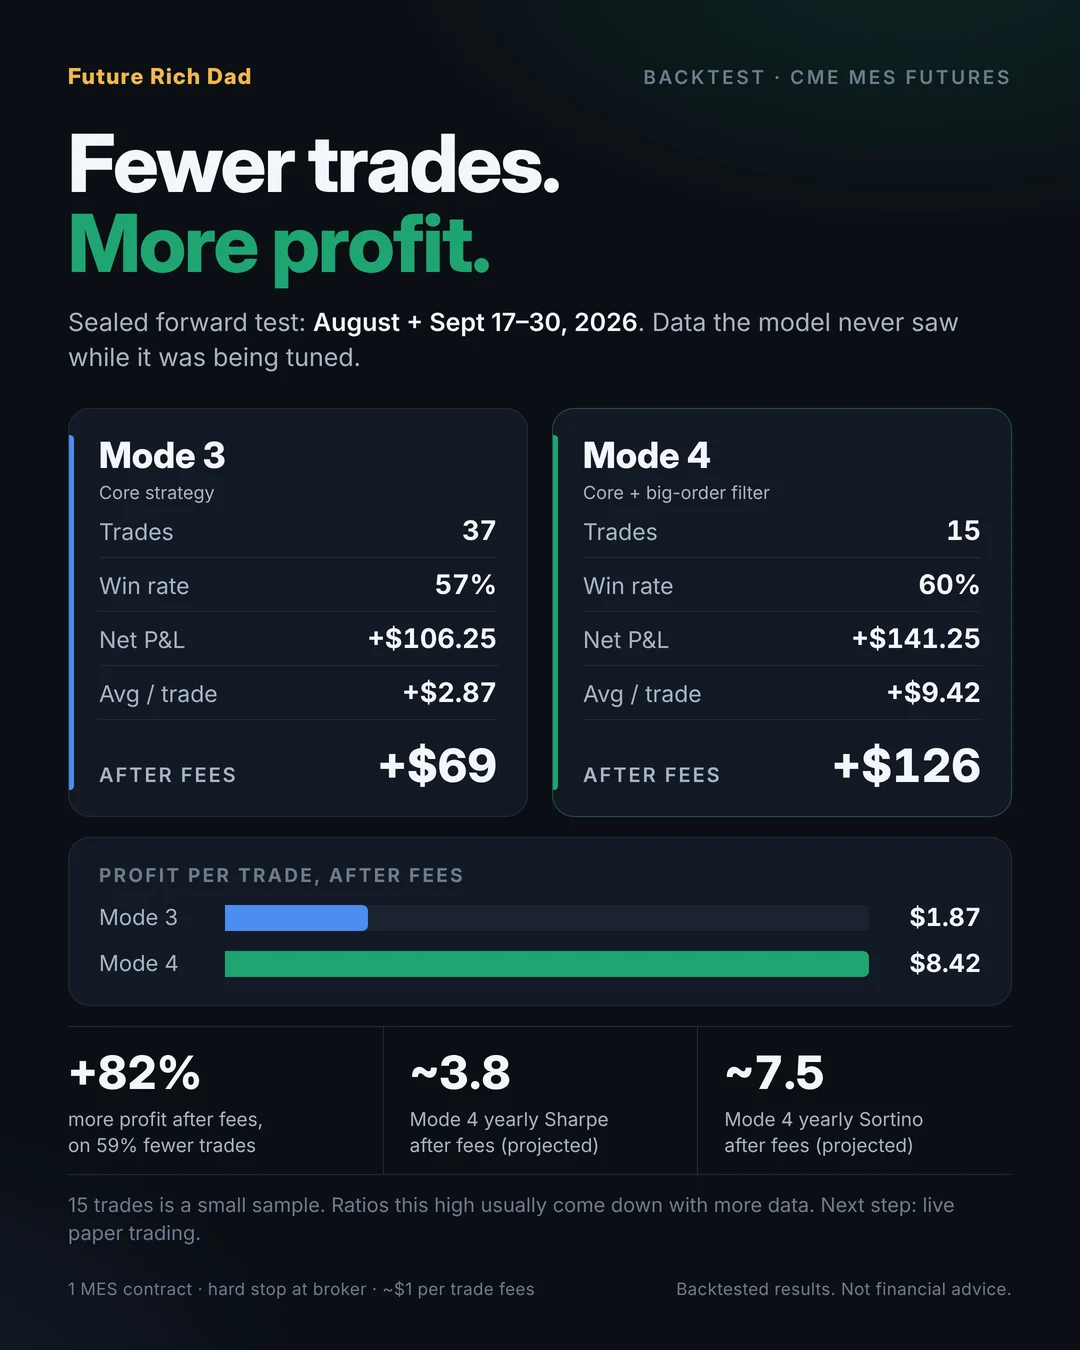
Results graphic comparing the core strategy and the filtered strategy on sealed forward-test data
Sealed data, after feesCoreFiltered
Trades3715
Win rate57%60%
Net P&L, 1 MES+$69+$126
Profit per trade$1.87$8.42
Yearly Sharpe1.43.8
Yearly Sortino1.87.5

31 sealed sessions (August and September 17 to 30, 2026), one Micro contract, about $1 per trade in fees. Fifteen trades is a small sample, and ratios this high usually come down with more data. Backtested results only. Not financial advice.

Next: a live data connection for paper trading, then a final sealed test on October before any real money.

Glossary

The terms this project runs on.

Market by order (MBO, Level 3)

Every individual order the exchange receives, with its own ID: adds, cancels, modifications and fills. It shows each order in the queue, plus the total size at each price.

Queue priority (FIFO)

At each price, orders fill first in, first out. Knowing where a large order sits in the queue tells you how much has to trade before it starts filling.

Sealed forward test

Data held back until the settings are frozen, then scored once. It is the closest a backtest gets to trading the future.

Sharpe and Sortino

Return divided by volatility. Sharpe counts all swings; Sortino counts only losing ones. A Sortino well above the Sharpe means losses stayed small next to the wins.

MES (Micro E-mini S&P 500)

A futures contract worth $5 per index point, a tenth of the E-mini. Each 0.25-point tick is $1.25, which makes it a practical contract for testing a strategy with real money at small size.

Built as a product, run like an experiment: a clear hypothesis, a testing process designed to catch my own mistakes, and decisions driven by data I wasn't allowed to see in advance.